︎︎︎ How to Custom Your Own Mechanical Watch
2022
Adobe Illustrator
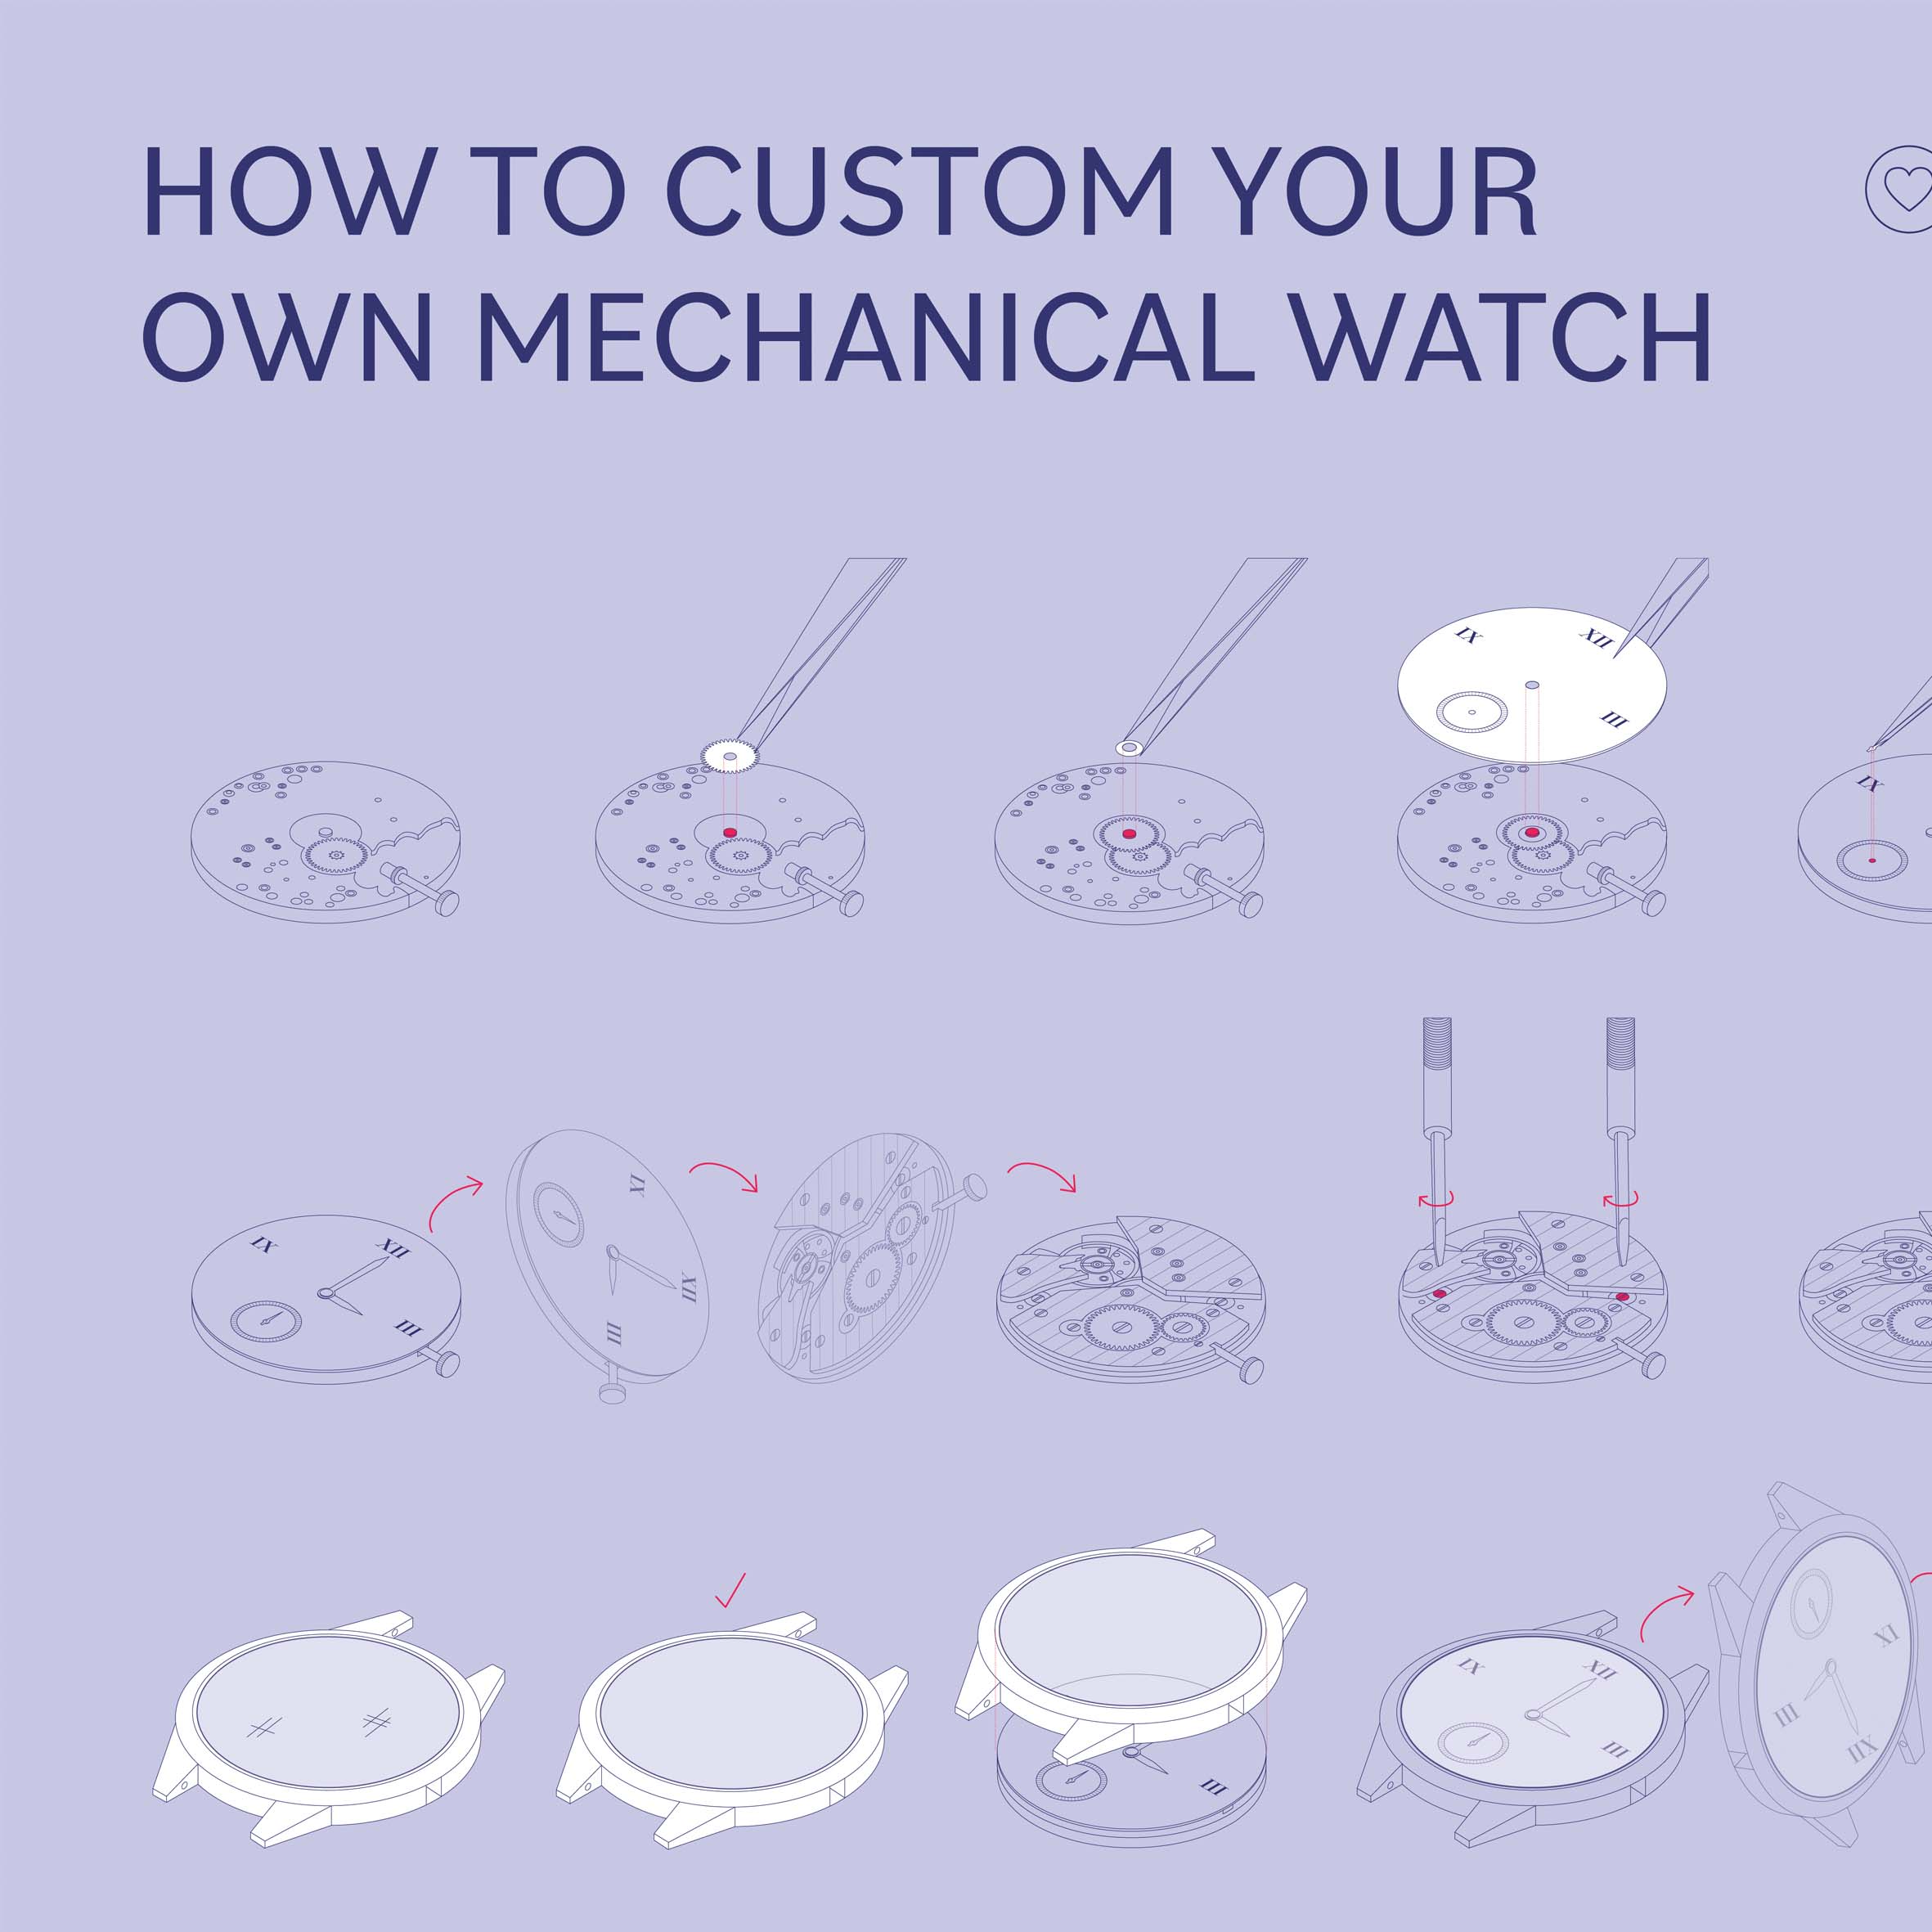
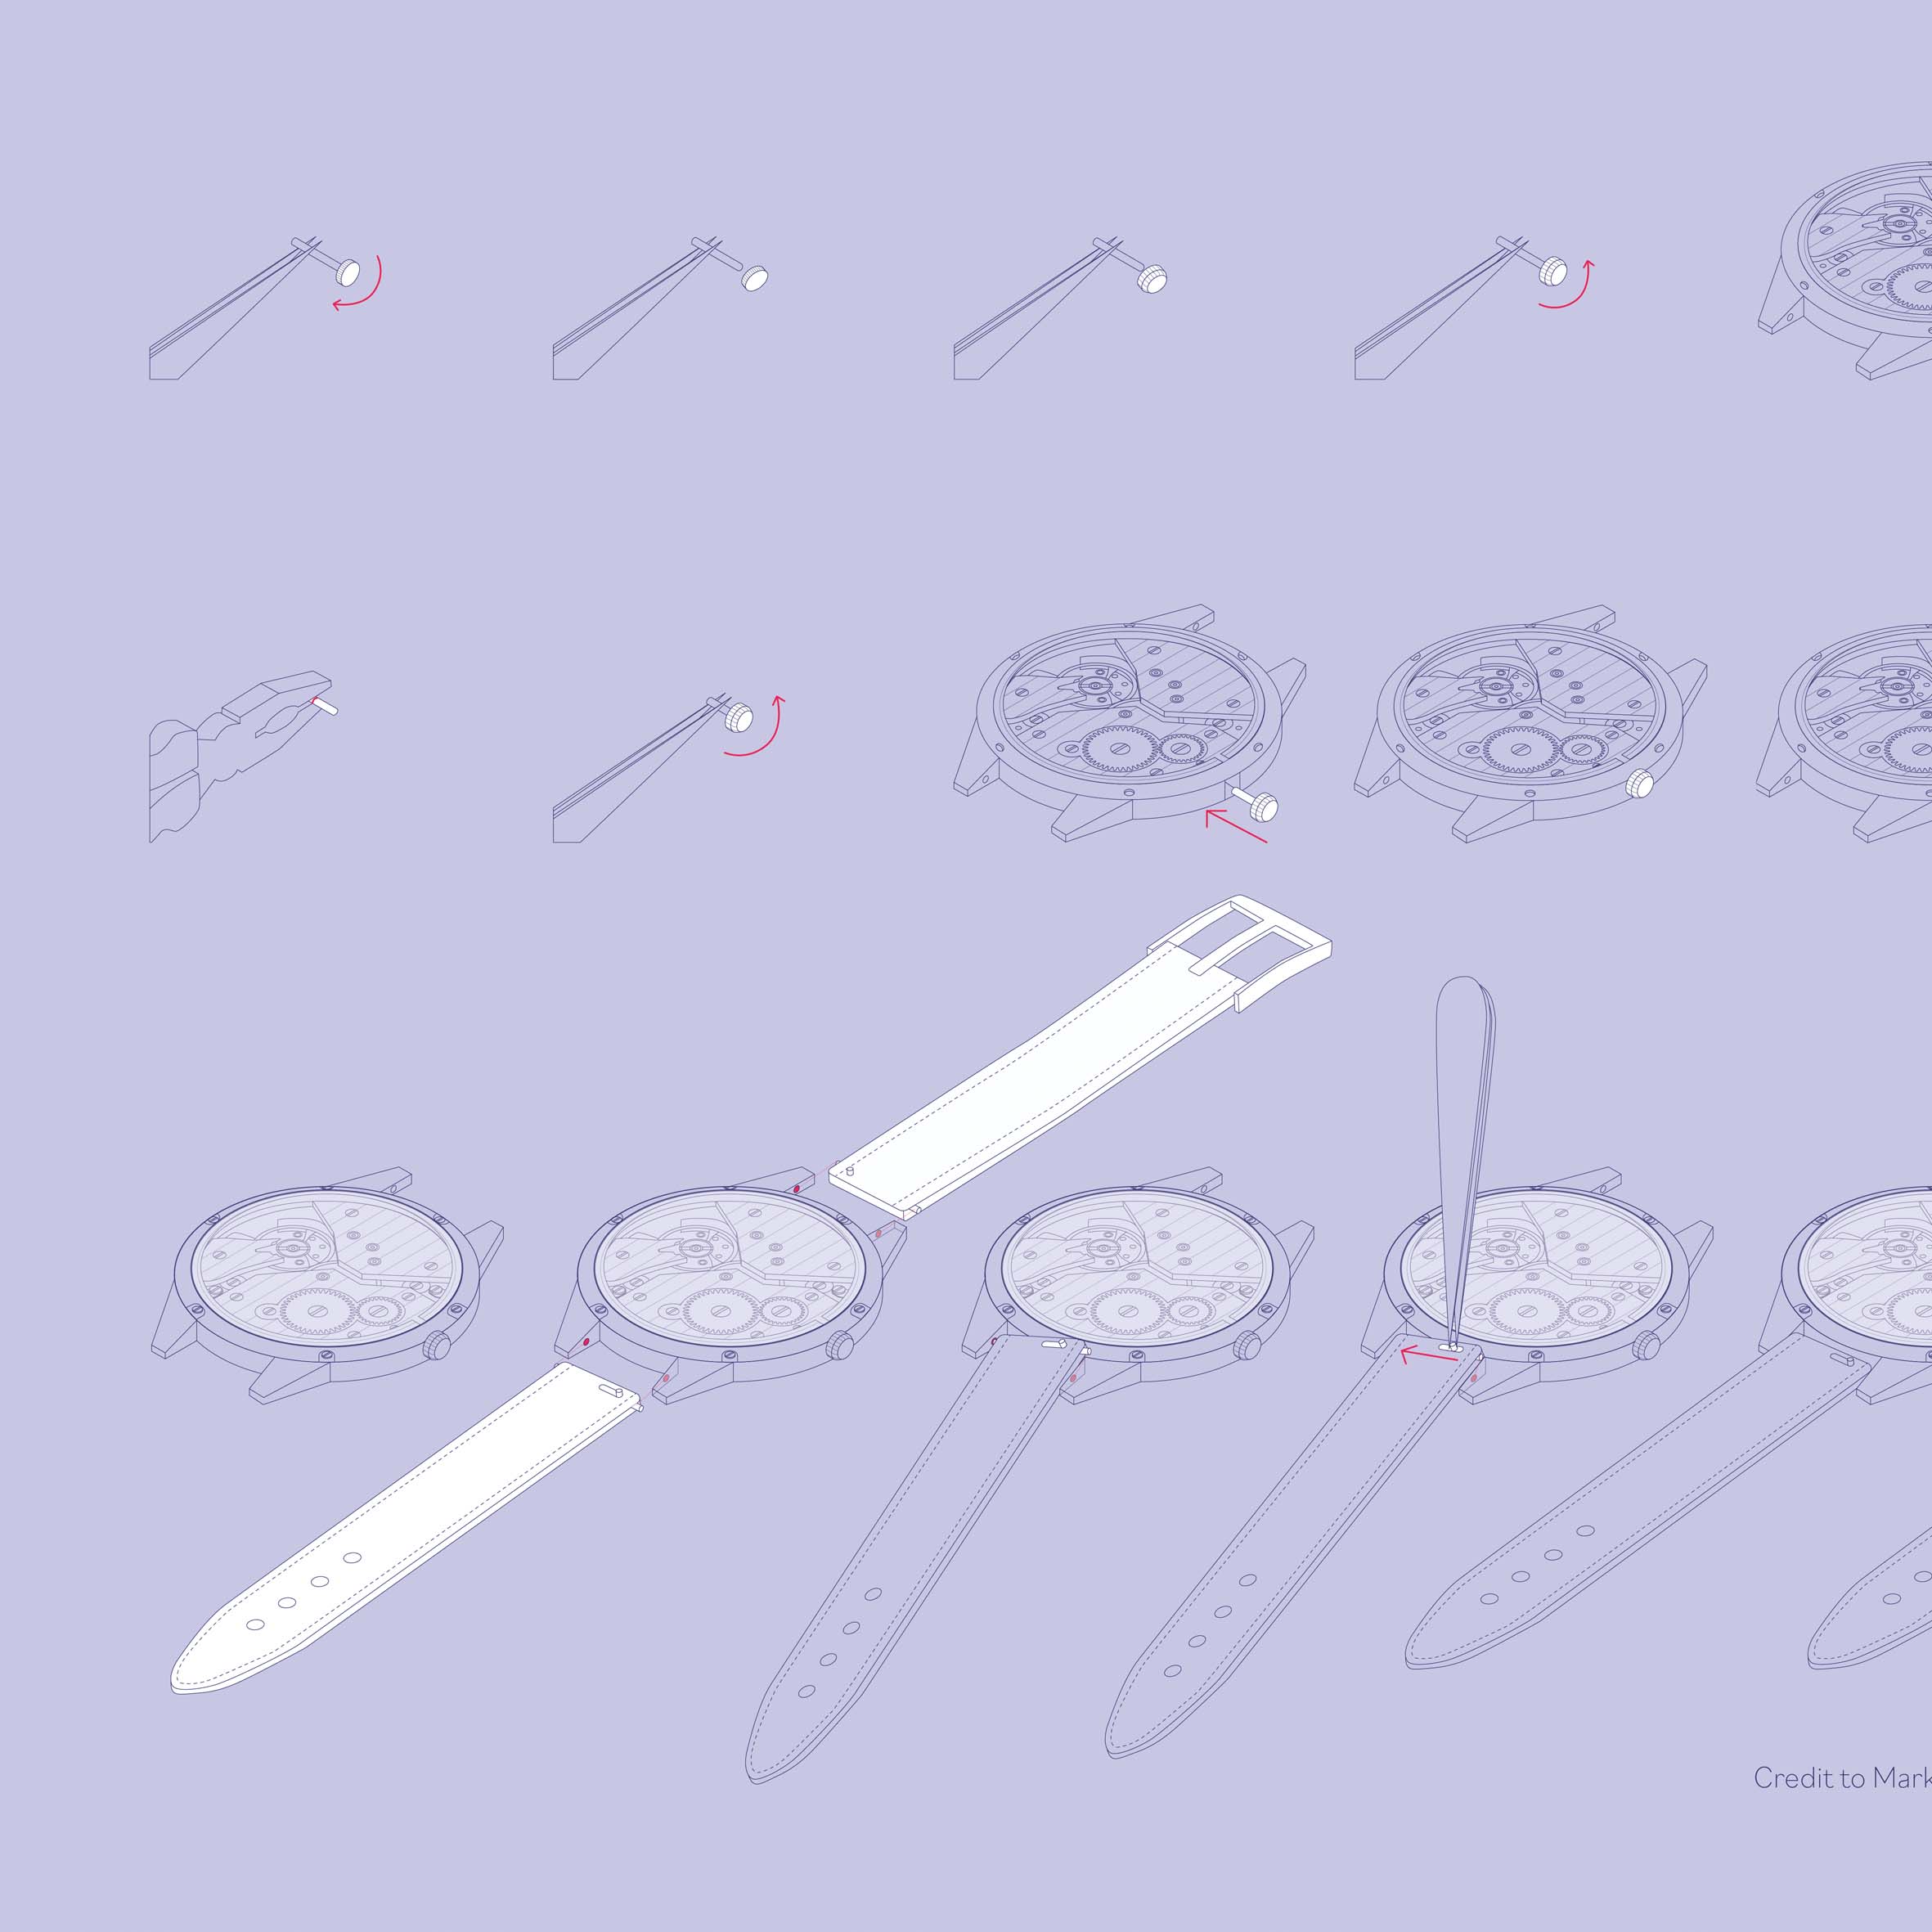
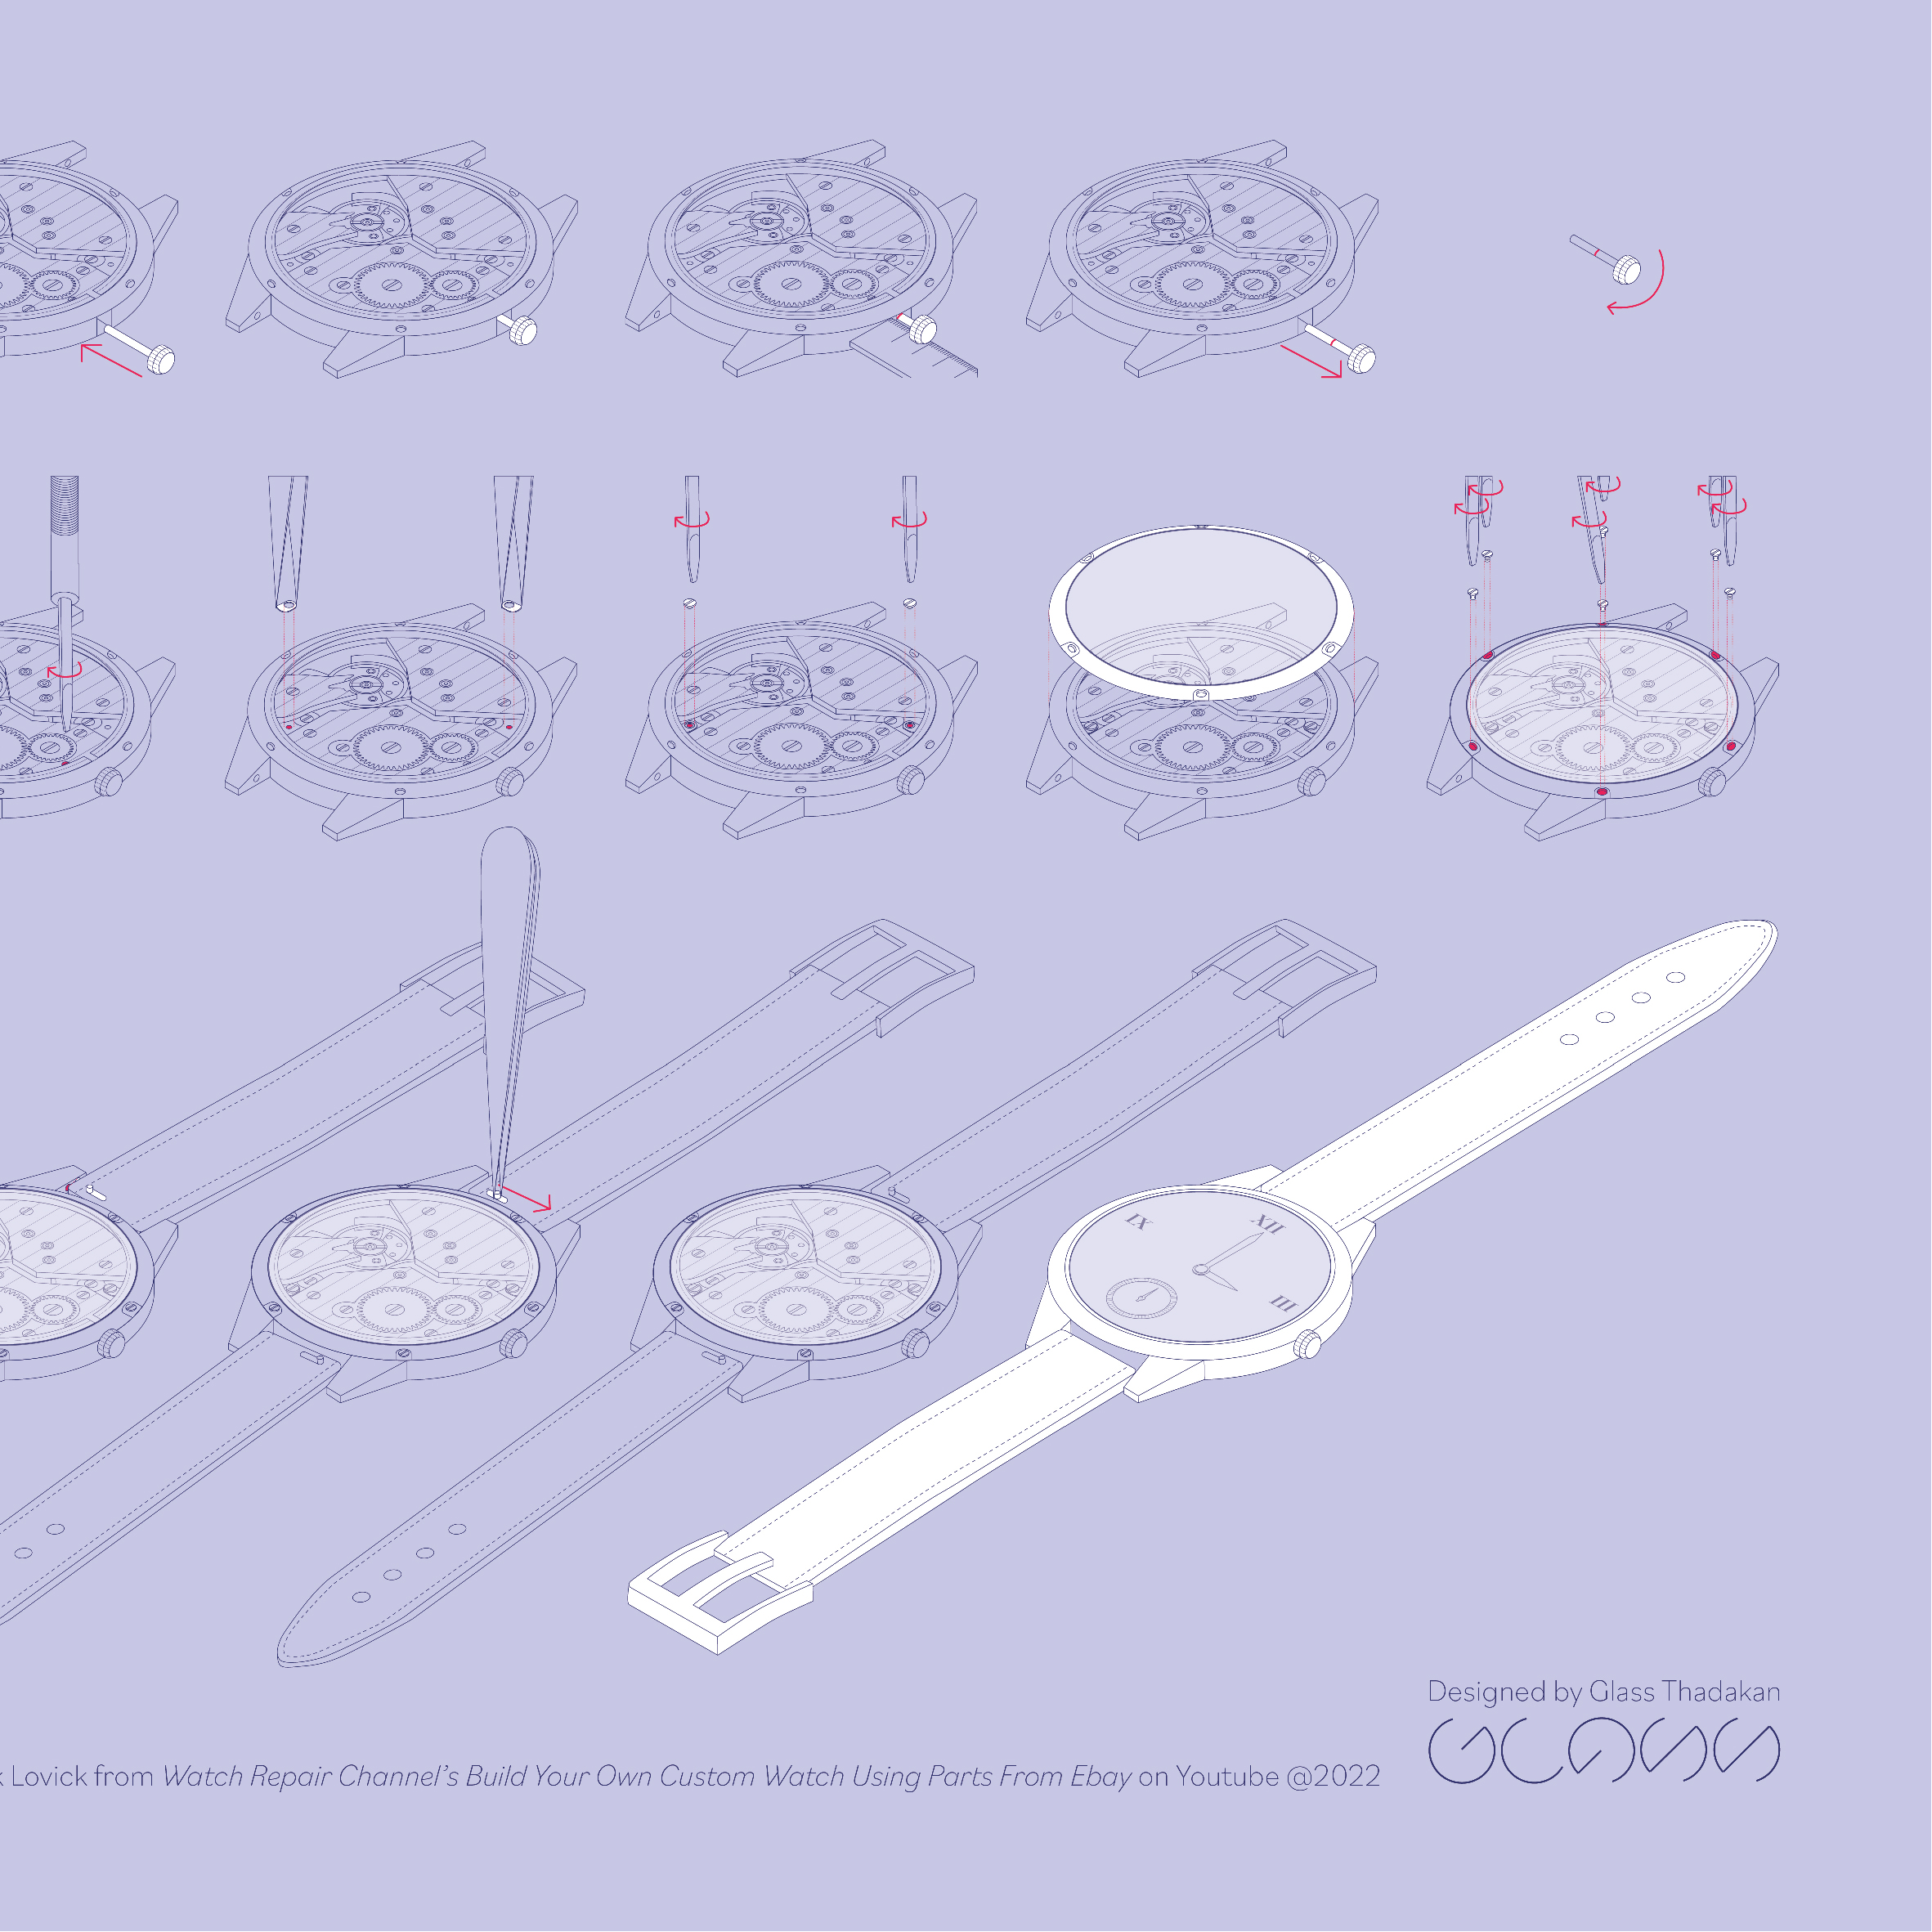
This is a wordless diagram displaying procedures of how to custom your own mechanical watch using parts from online shopping. It shows precise steps of how you can combine each of your favorite parts of the watch into your own very special one easily according the steps.


︎︎︎ Dinosaurs Fossils in Jurassic Park Trilogy
2022
Adobe Illustrator
An information design of charts, graphs, map, and wordless diagram to display the data of the dinosaurs in the Jurassic Park Trilogy. It comprises of the information about the screen time of each dinosaur and where you can see the real fossils in museums. It also has paleontology related information about where their actual fossils were discovered and a brief information about the detail.


︎︎︎ Library Hour
2023
Figma | Photography | Adobe Lightroom
An information design of charts and graphs, displaying data of special book collection at Luca School of Arts. It is mainly focus on the information about reading time of each book. It also displays other general detail of the books. I started the project from the concept, photography, photo editing, and all the workflows.
︎︎︎ 397 Hours 55 Minutes of 204 Movies in 2021
2022
Adobe Illustrator
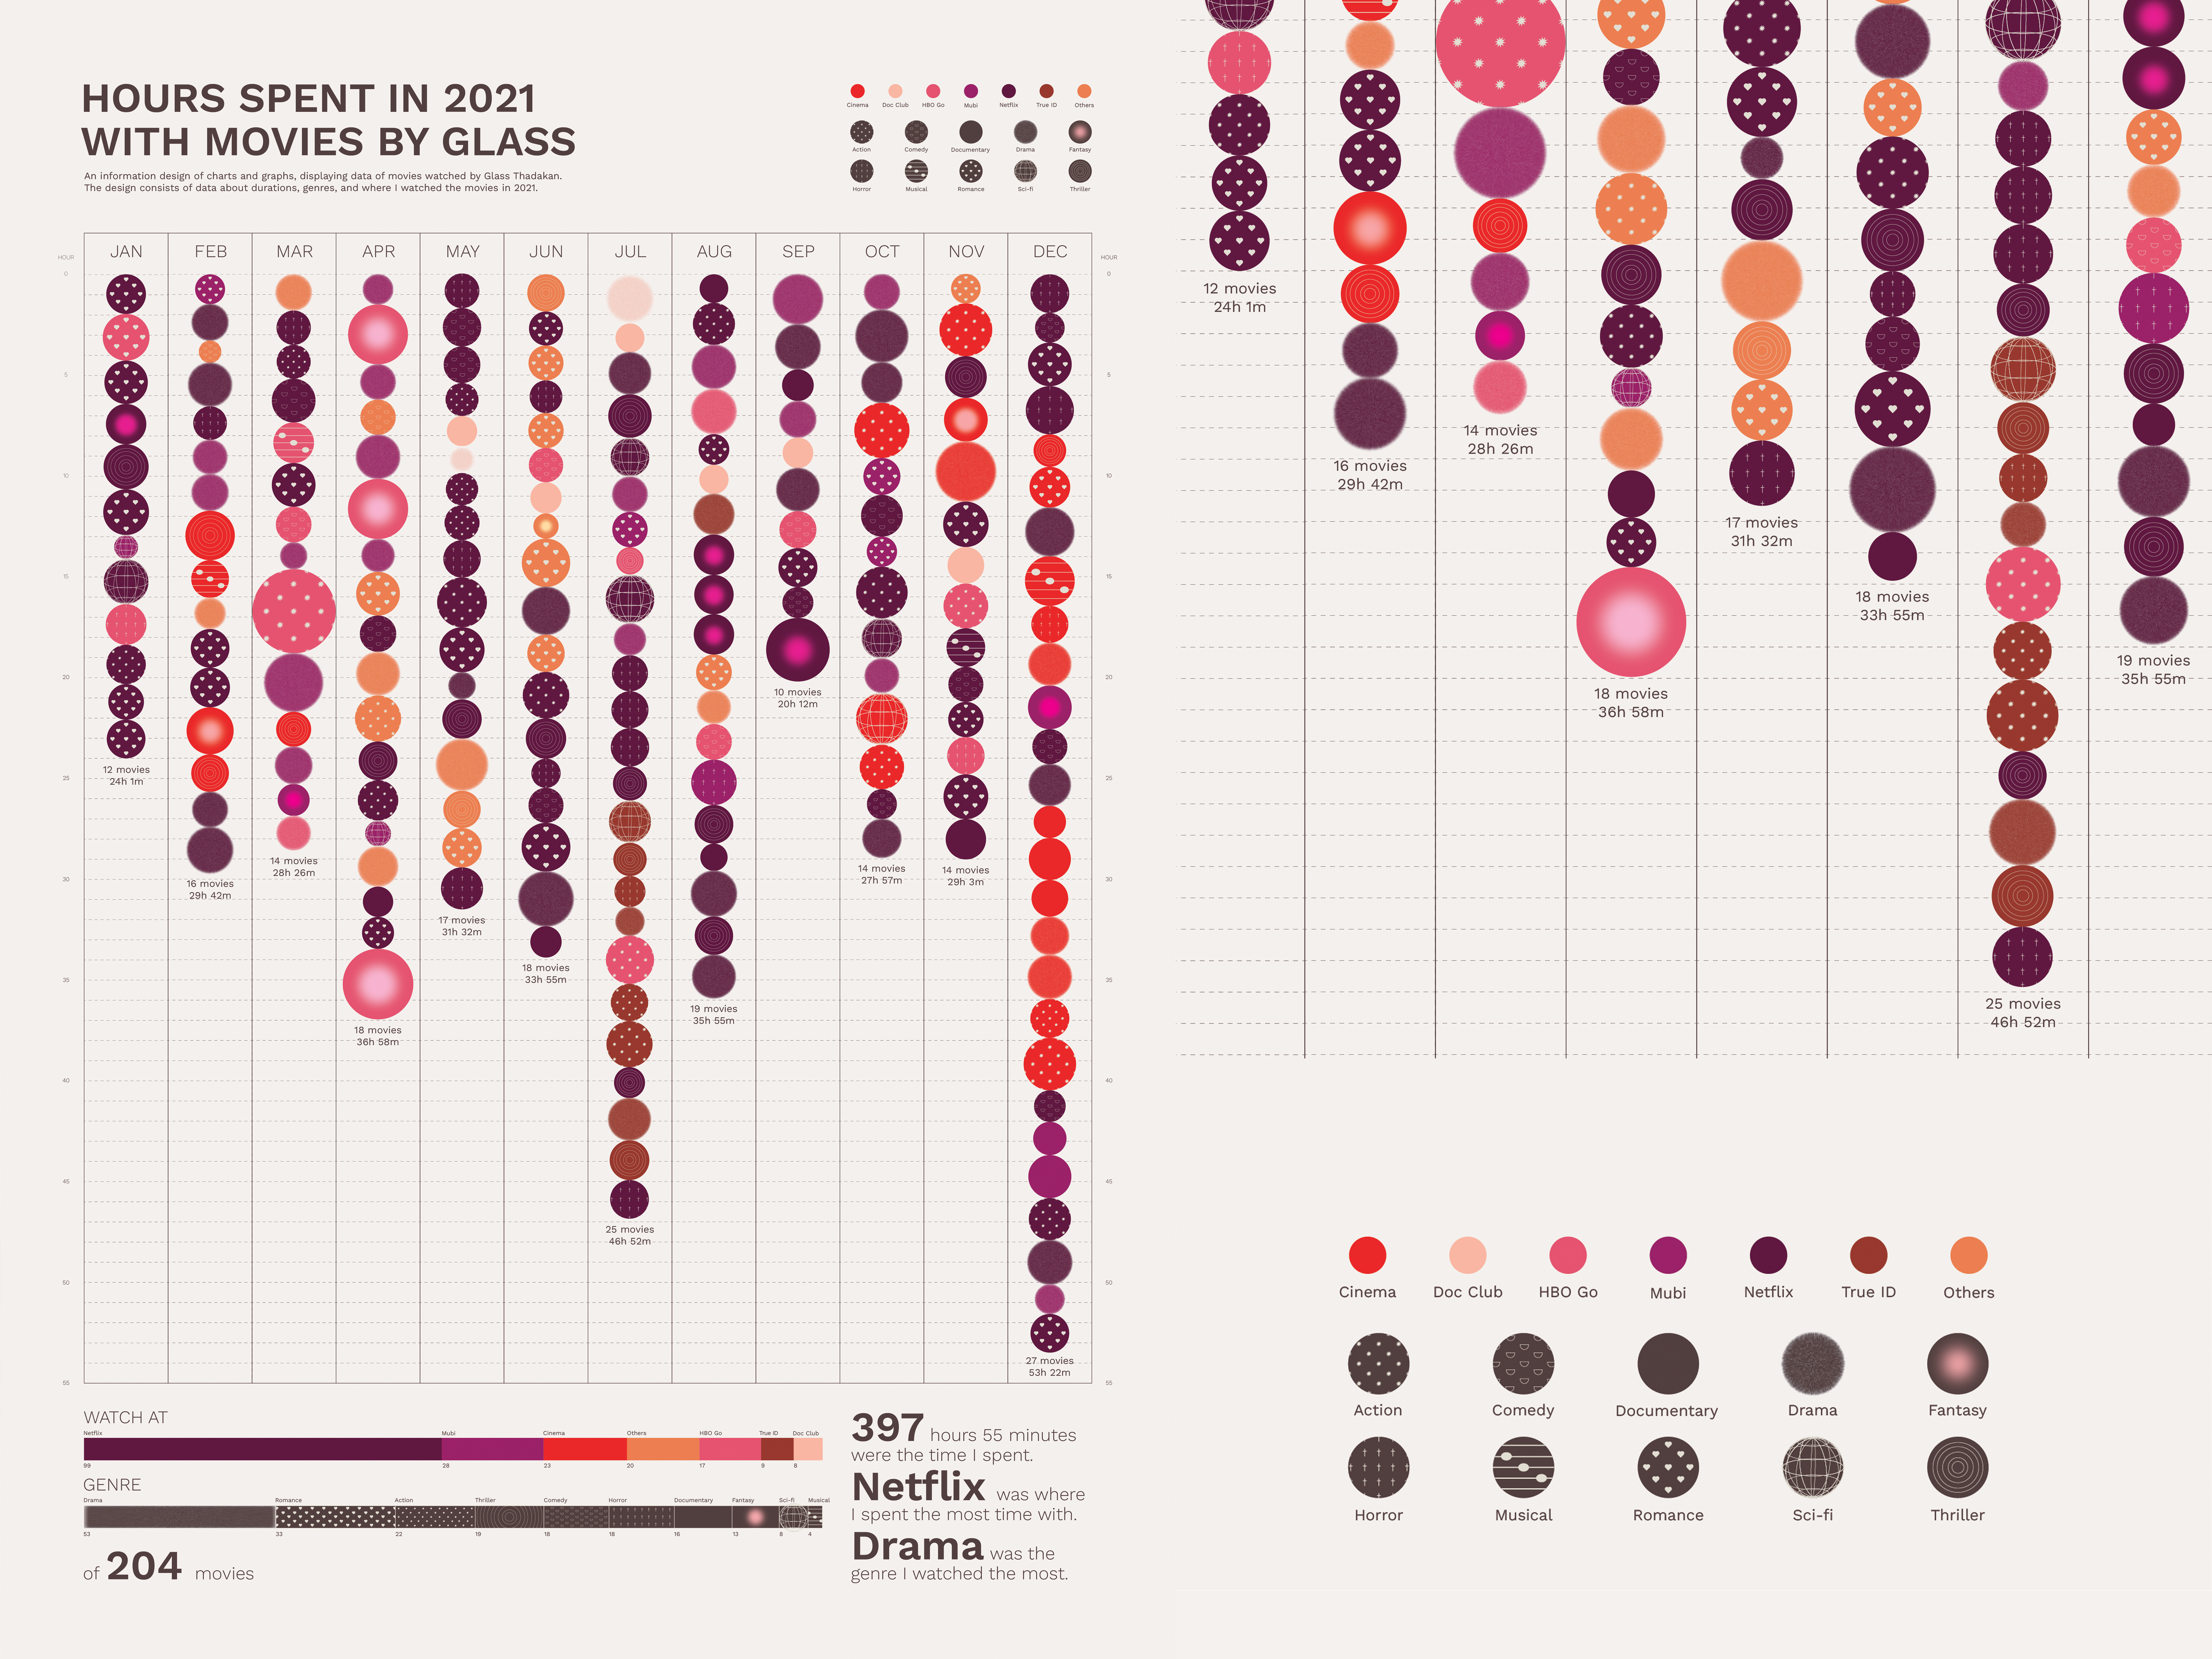
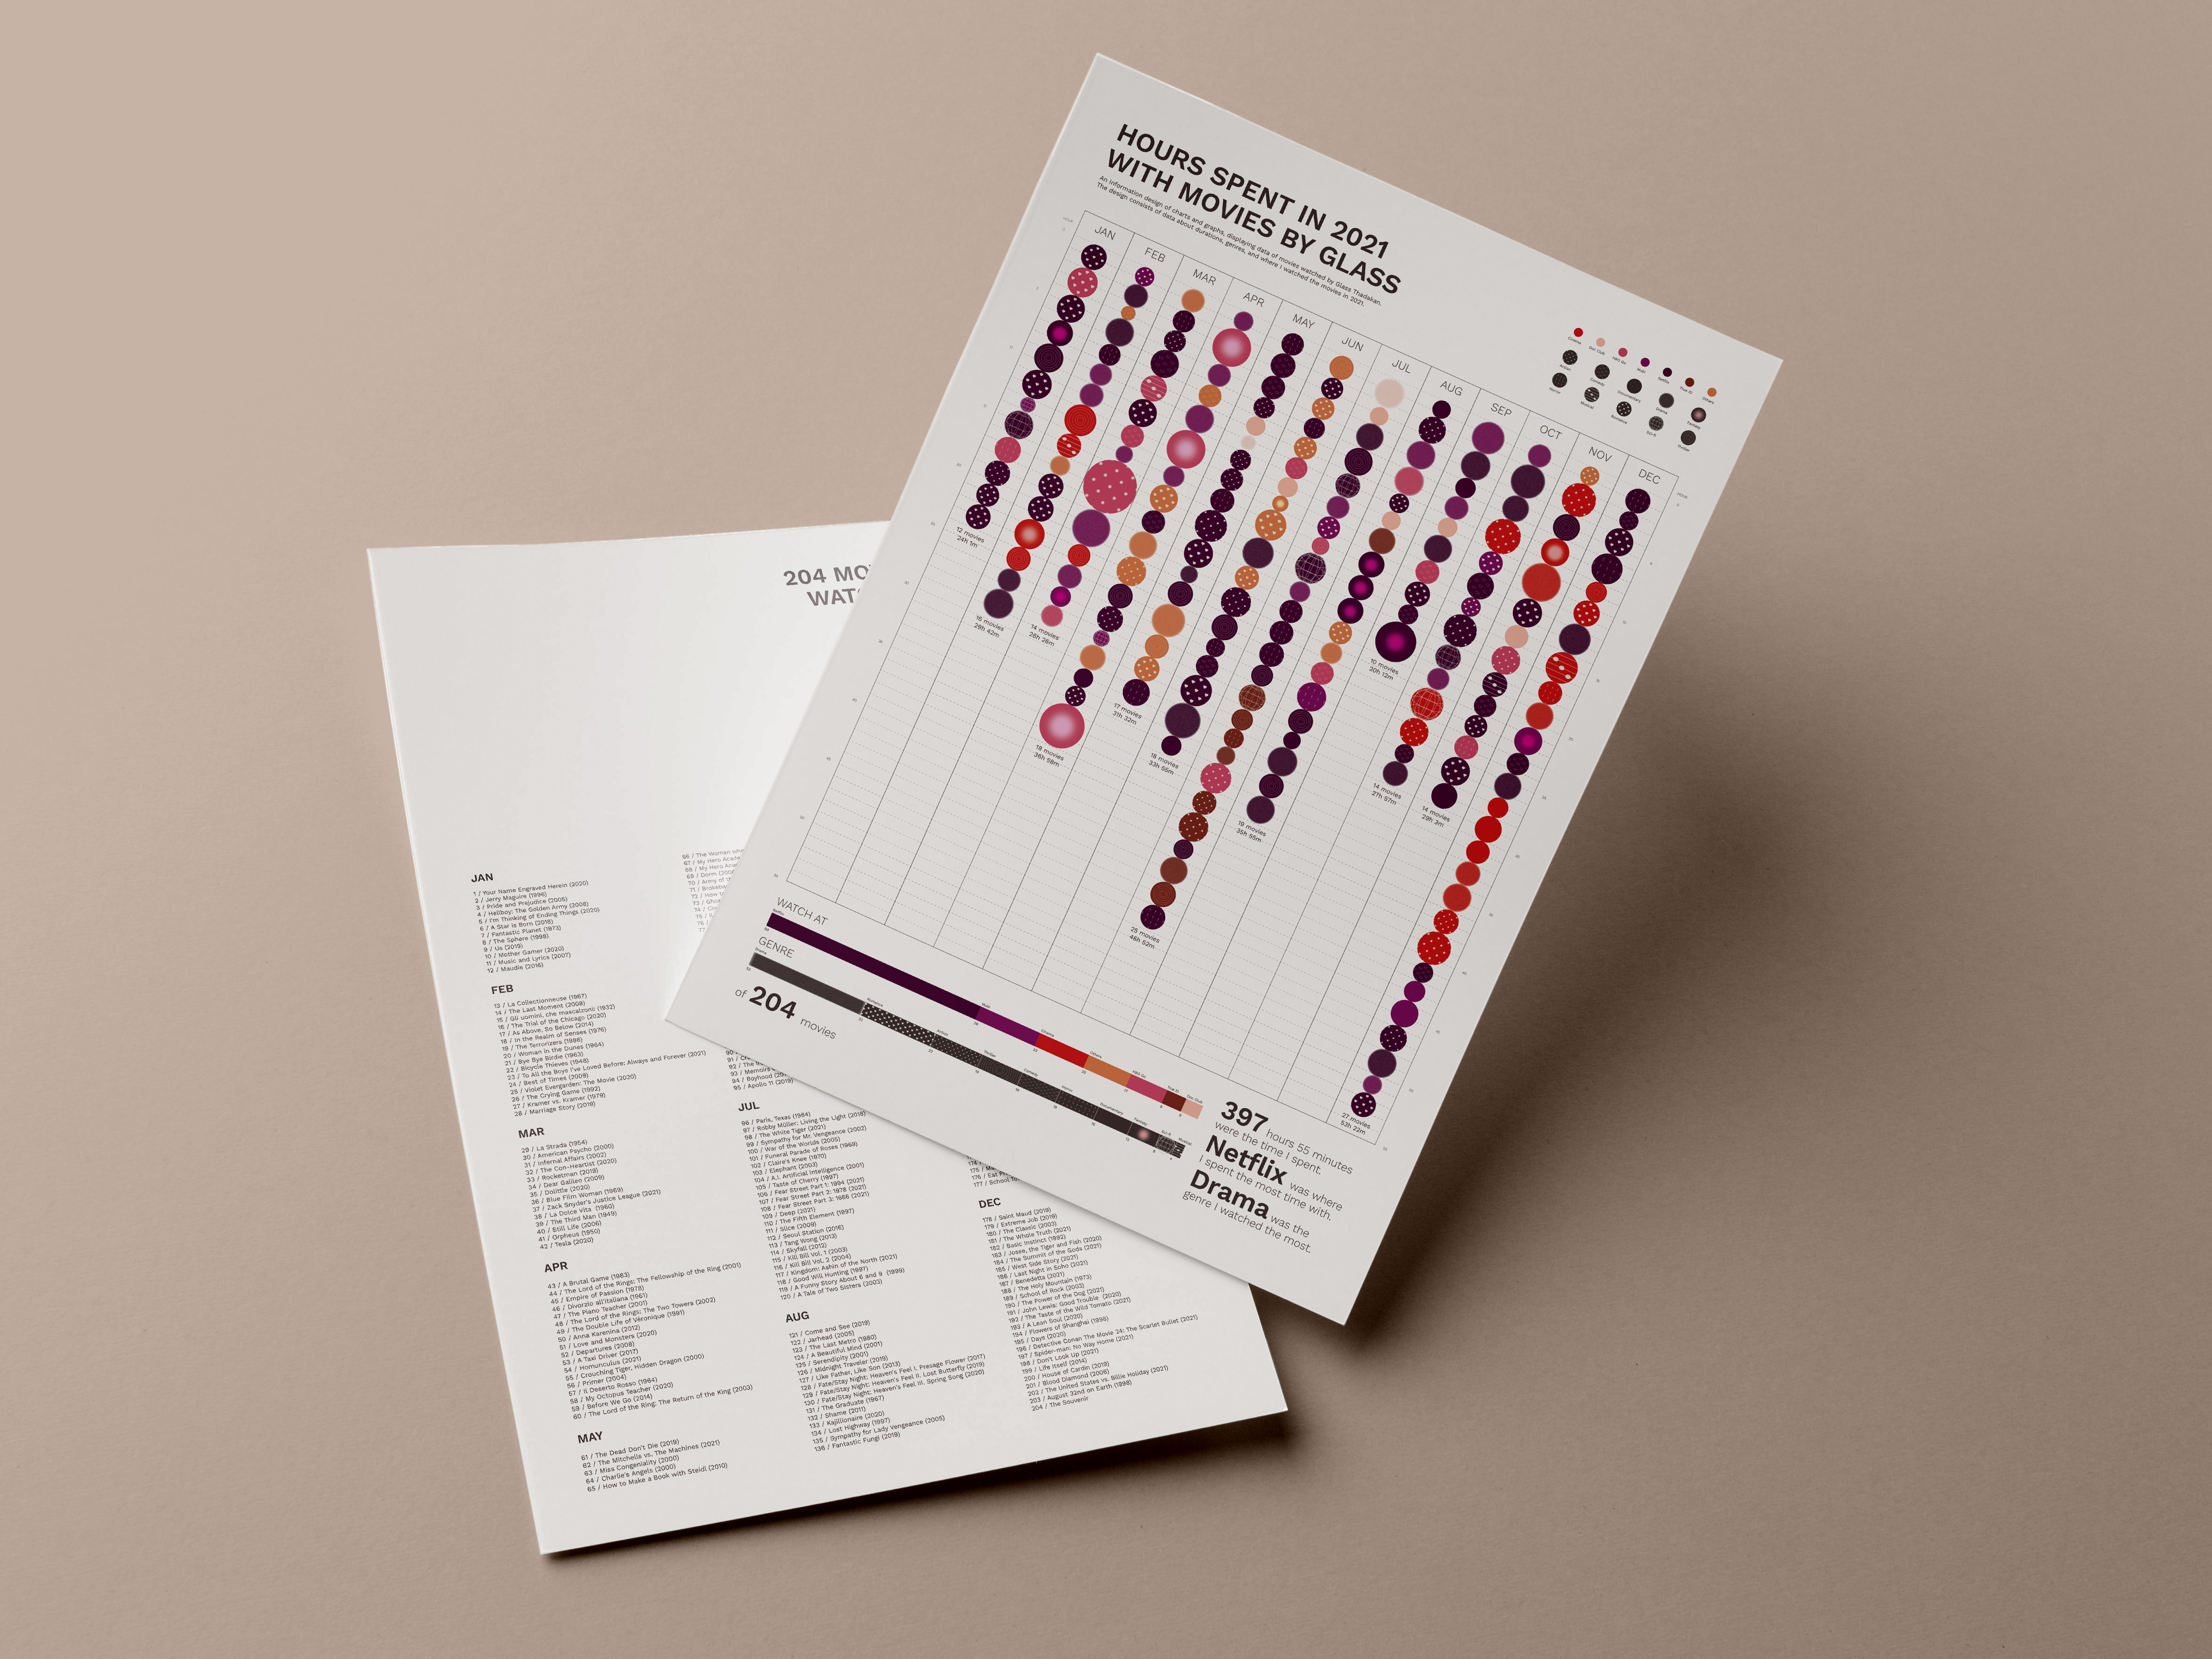
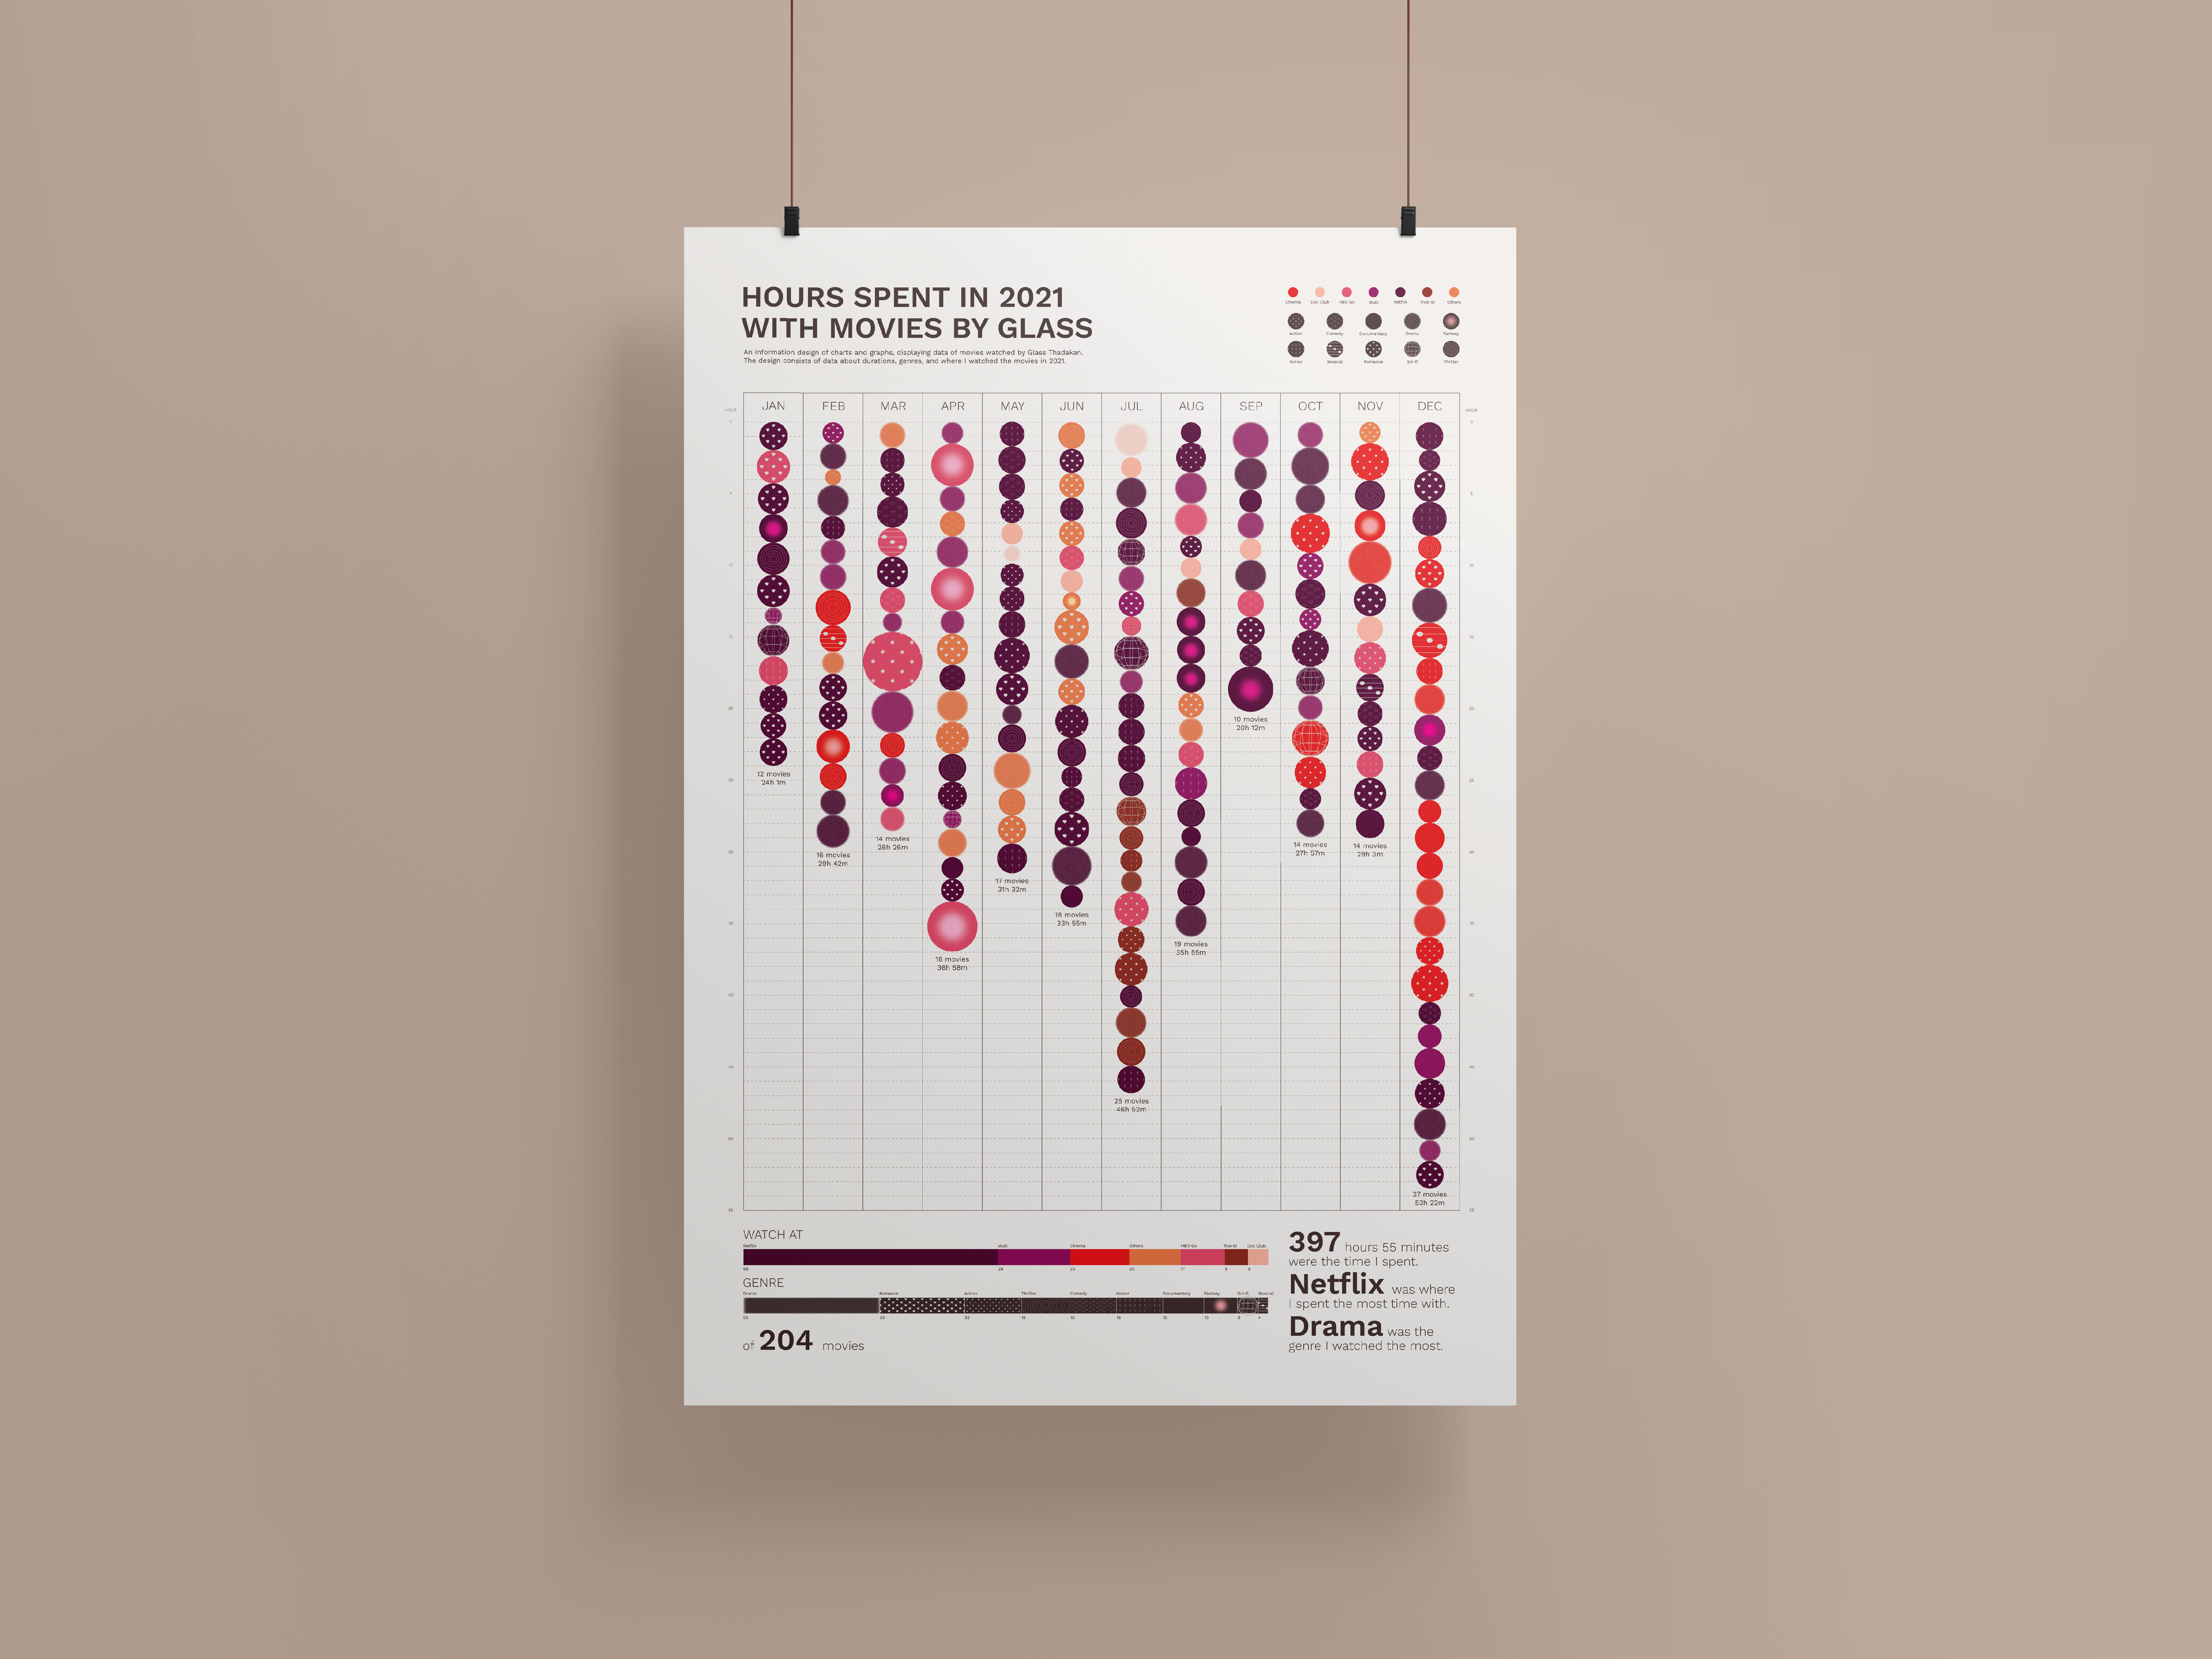
An information design of charts and graphs, displaying data of movies watched by Glass Thadakan. The design consists of data about durations, genres, and where I watched the movies in 2021.
︎︎︎ The House of G
2022
Adobe Illustrator
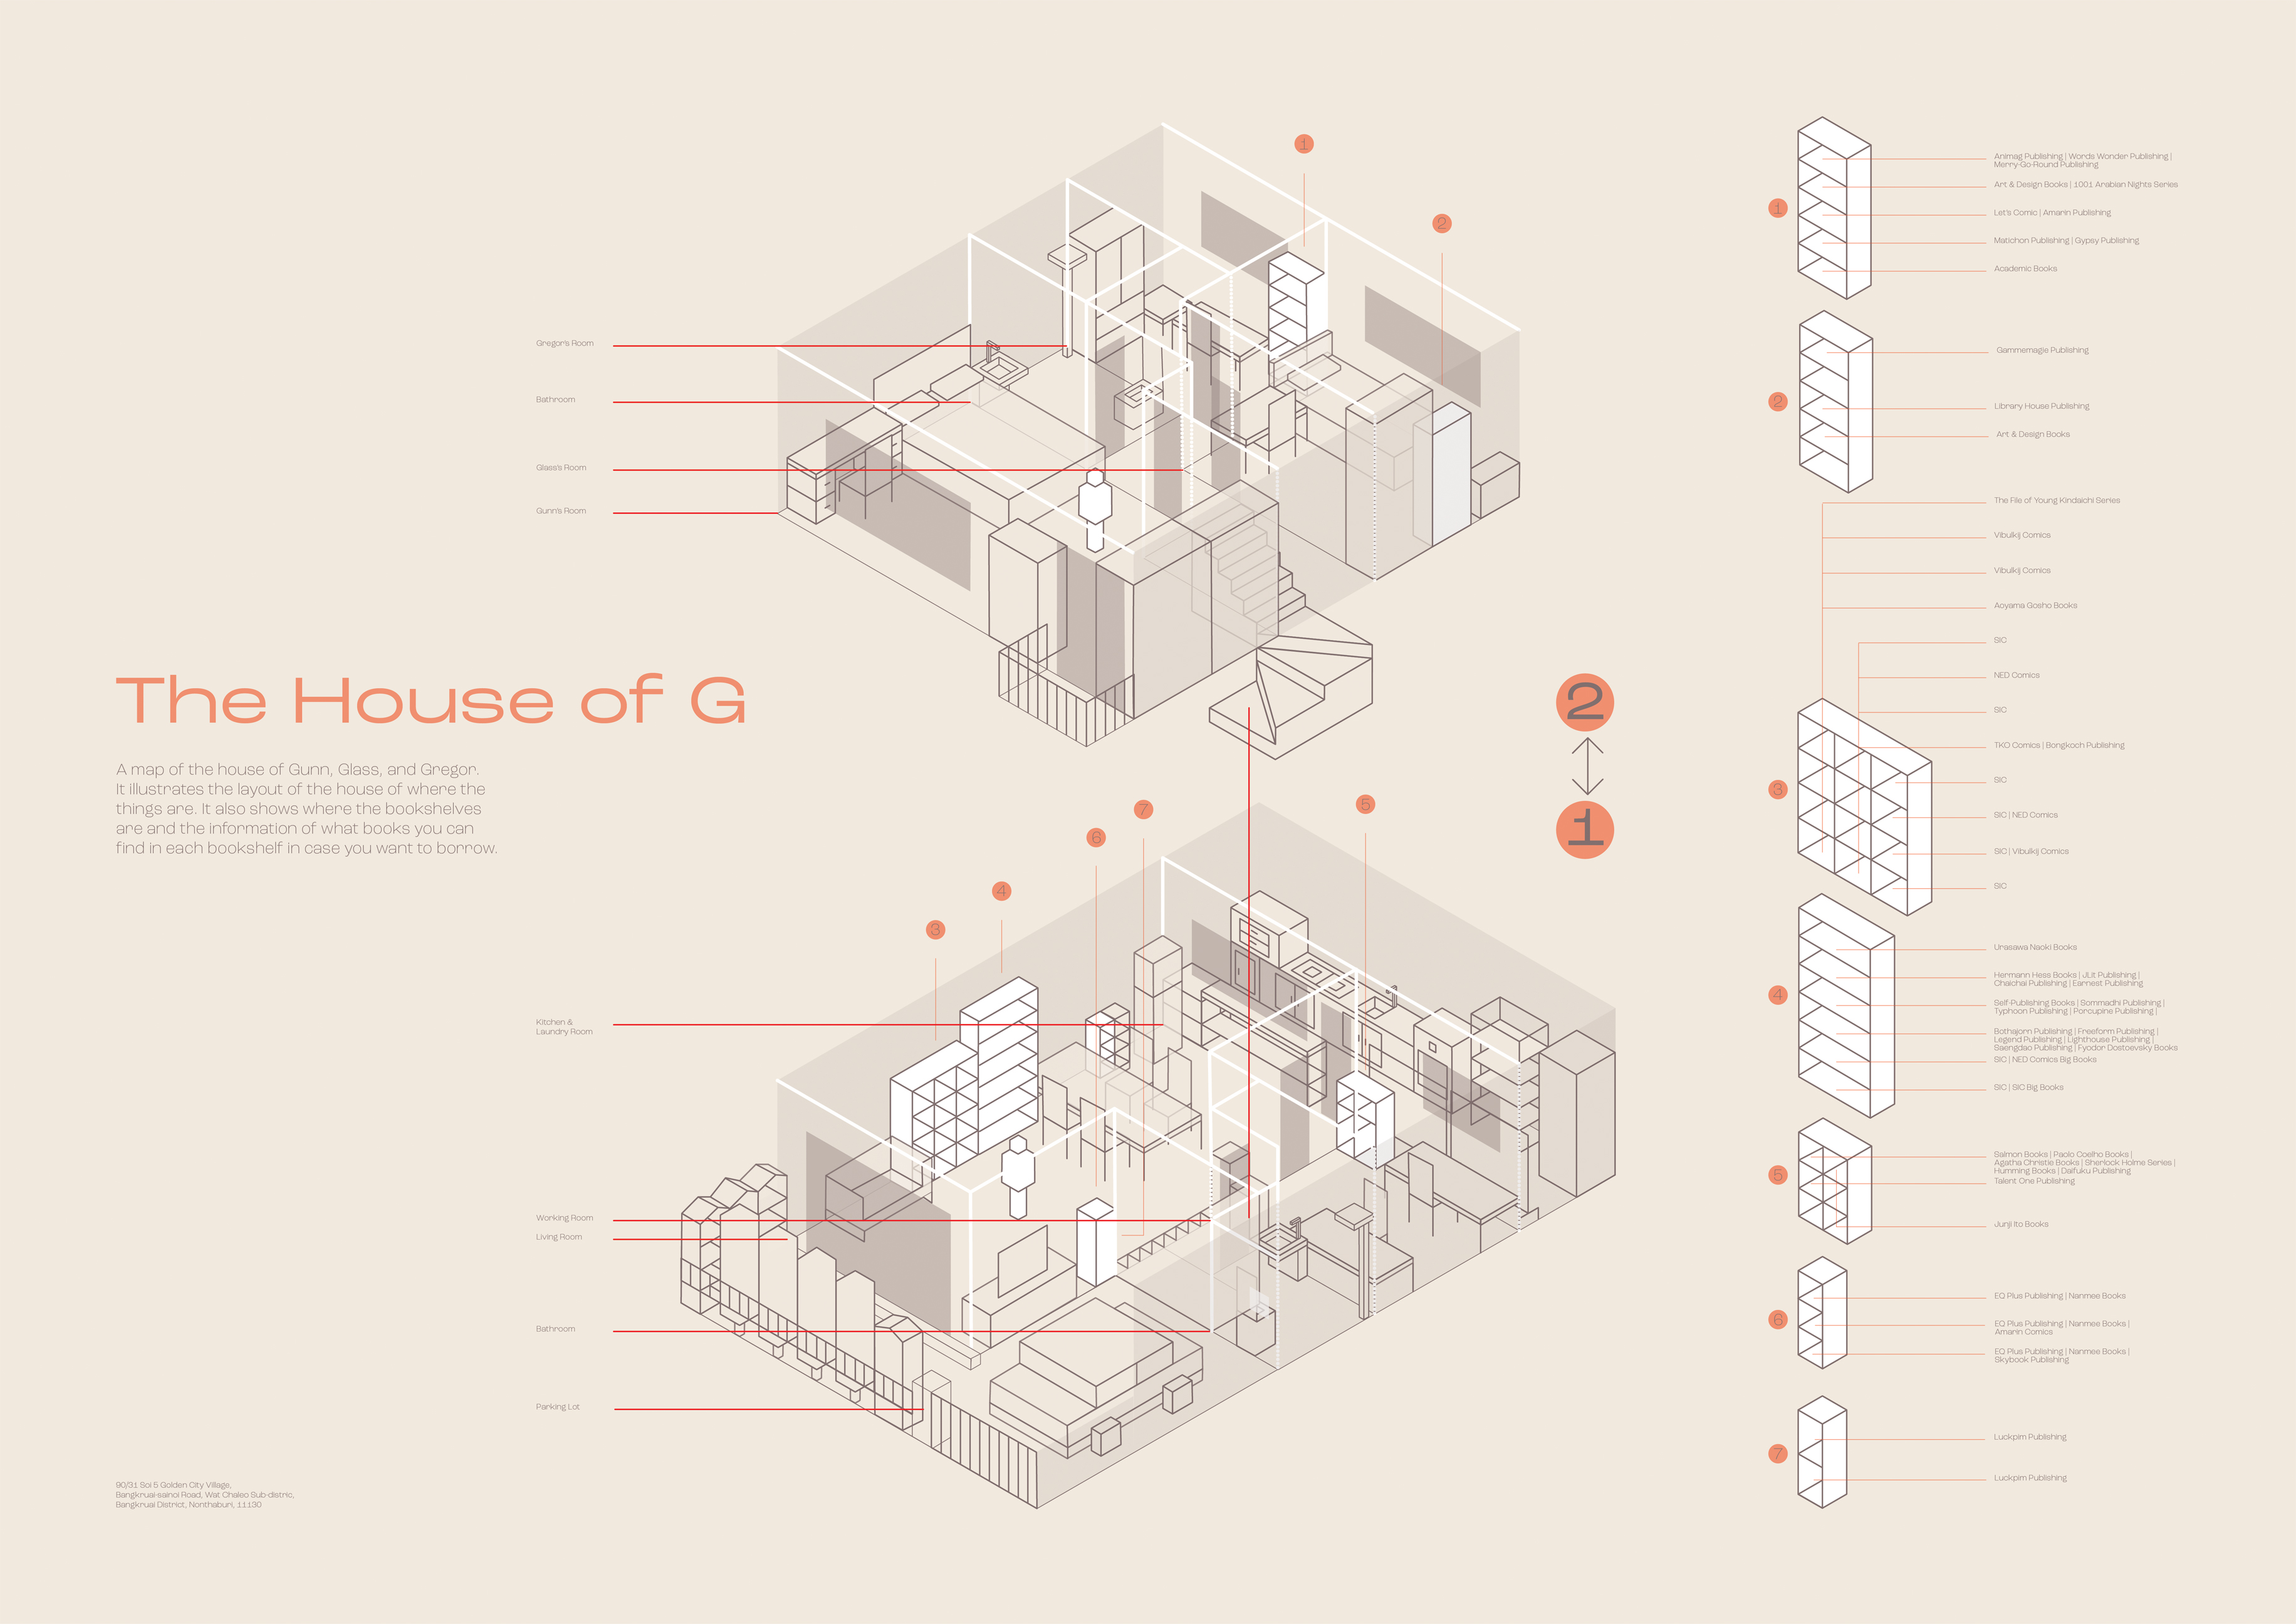
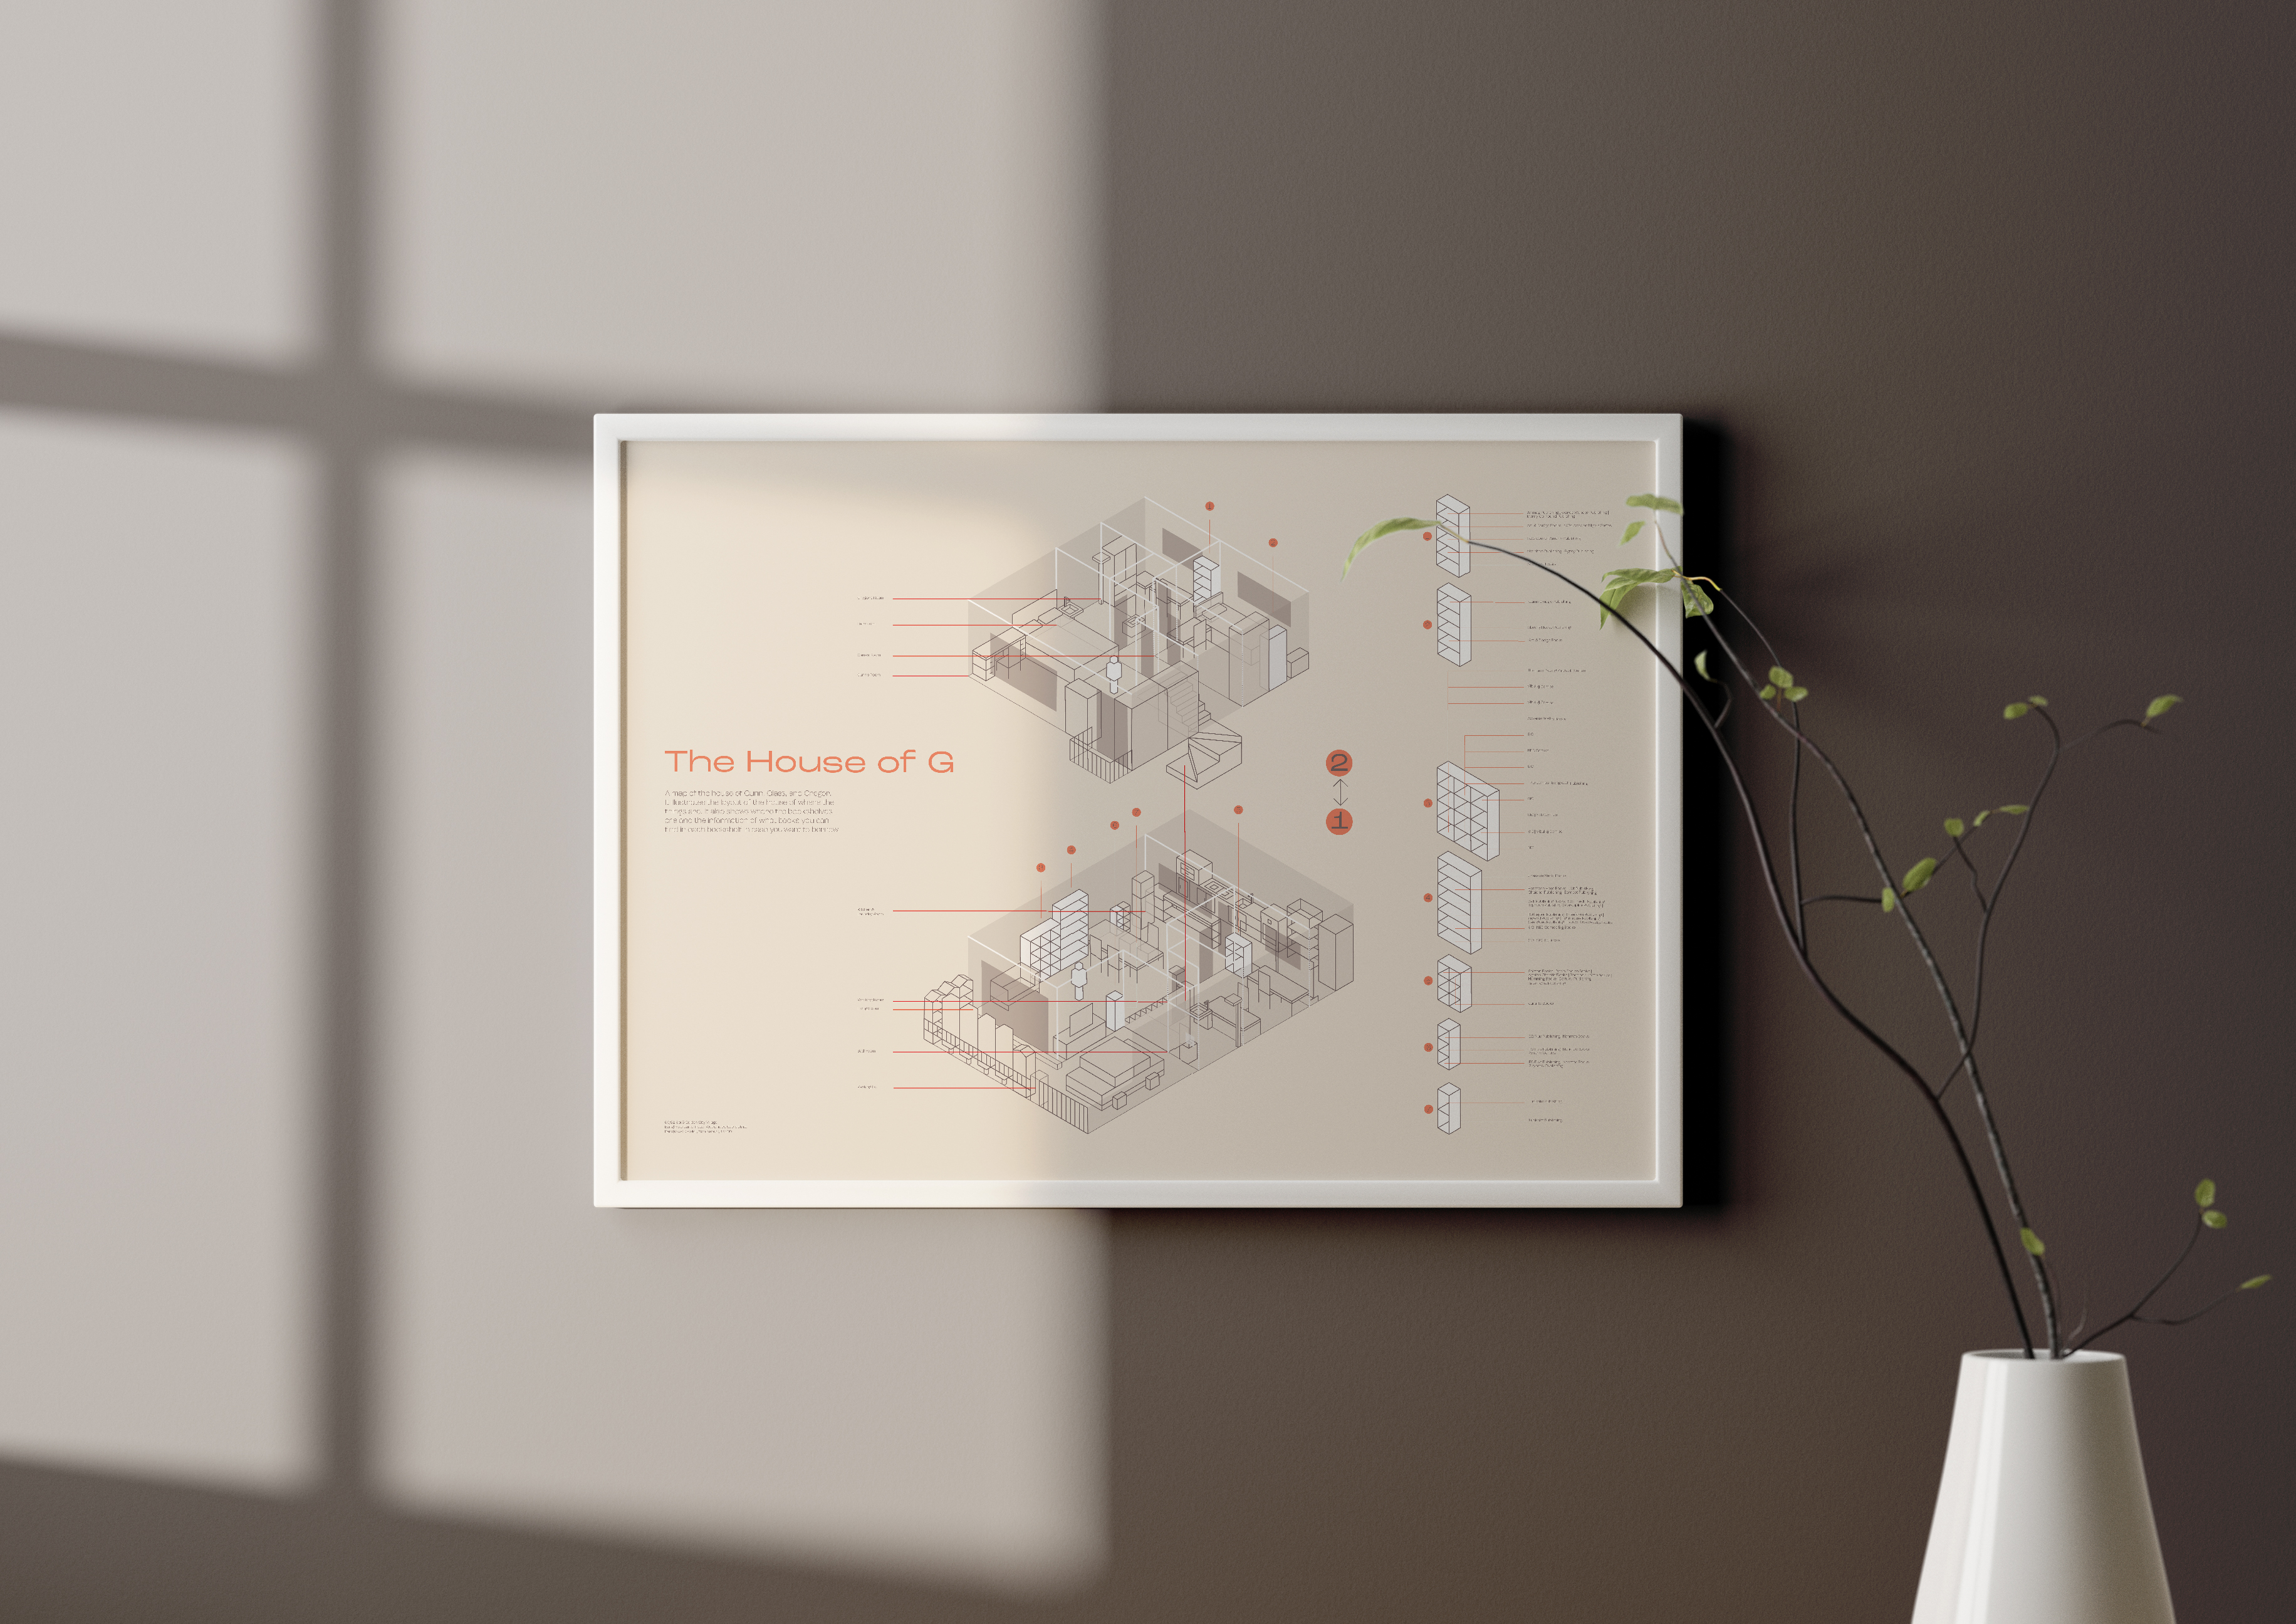
A map of my house.
It illustrates the layout of the house of where the things are. It also shows where the bookshelves are and the information of what books you can find in each bookshelf in case you want to borrow.
︎︎︎ 8 Months of My Life
2023
Adobe Illustrator
This exchange year, I found myself going out a lot in contrast as when I was in Thailand. I wanted to track the days I went out and the reasons of it. This information design displays the locations when I went out and the walking steps I took.


